Contact Us
support@techfourtech.com
(318) 595-0113
Follow Us:

Experience the Award-Winning Experts for Phones and Computers!
Discover Why We're Award-Winning! Join Our Growing Community of Satisfied Customers and Experience the Best of the Best in Lincoln Parish!
PREMIUM SERVICES
Fixing devices made easy. We've got you covered.
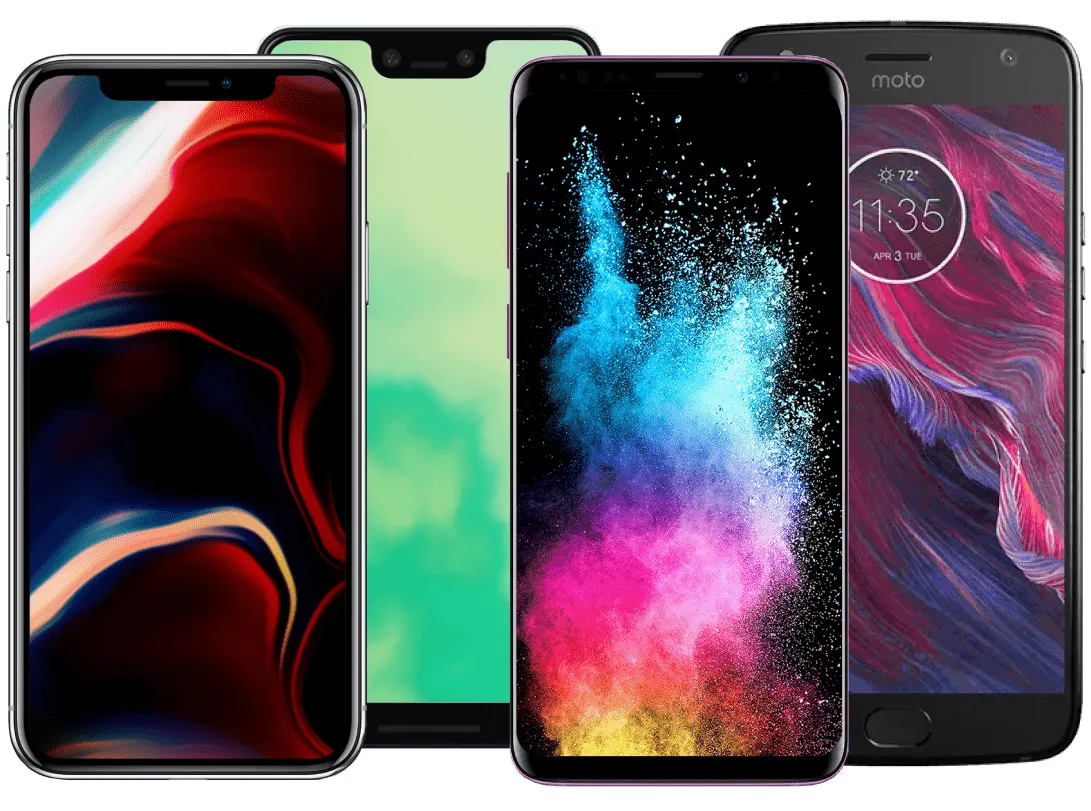
Smartphones
Get your devices back in action with our expert screen repair services for smartphones. Fast, affordable solutions just a click away!
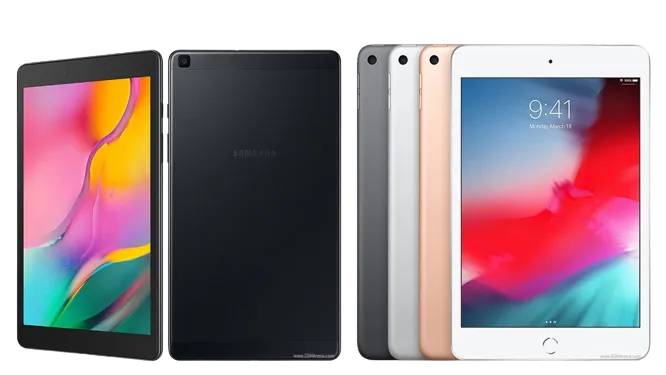
Tablets
Get Your Tablet Back Up and Running in No Time! Fast, Convenient, Affordable - Contact Us Today.
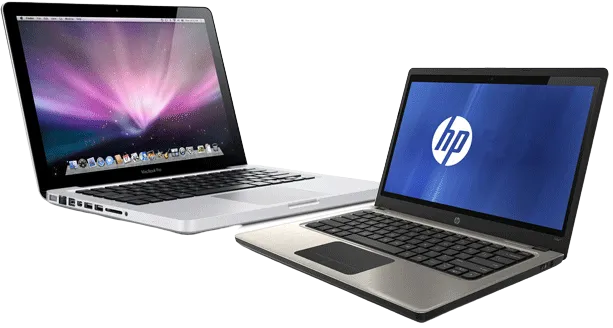
Computers
Get Back to Business with Our Expert Tech Services - Fast and Reliable Data Backup, Transfer, Screen Repair & Sluggish Fixes. Book Now!
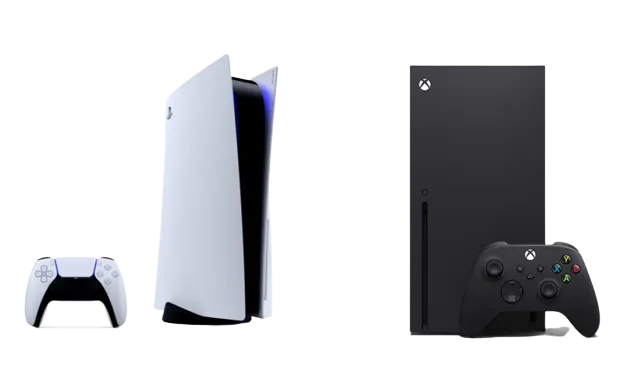
Consoles
Get your devices back in action with our expert screen repair services for all computers and phones. Fast, affordable solutions just a click away!
About Us
TRUSTED PHONE & COMPUTER SERVICE SHOP
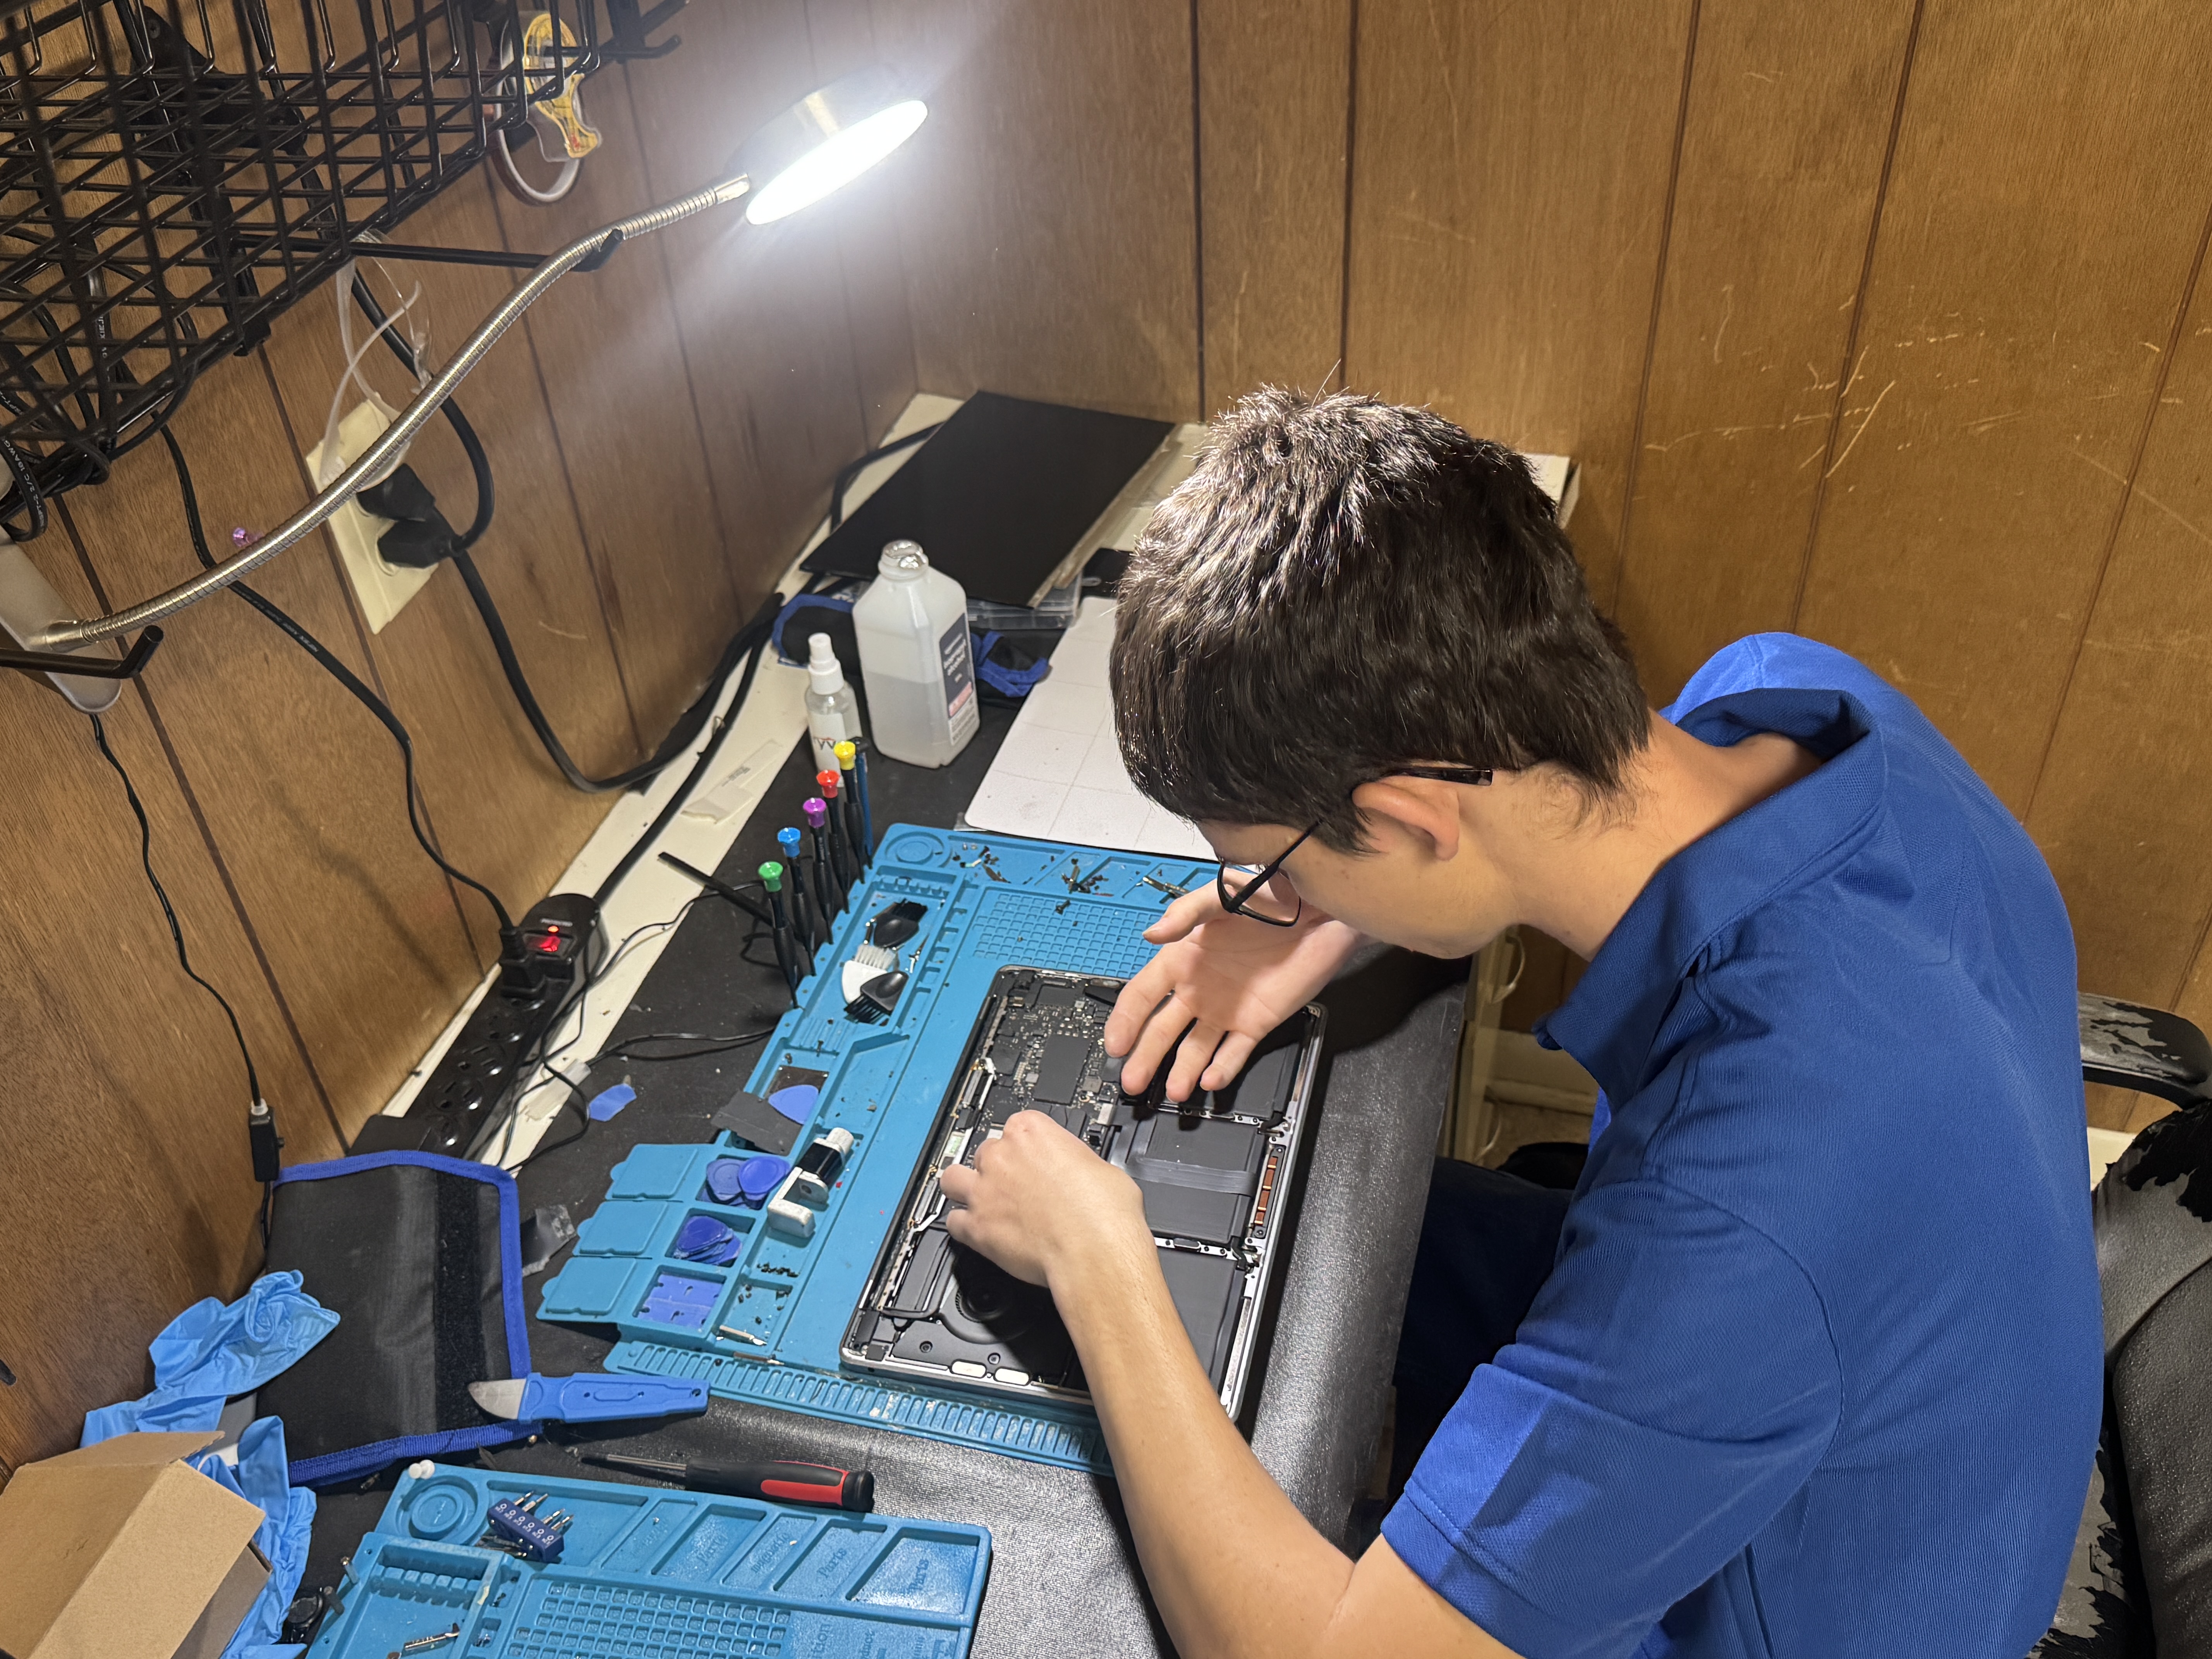
OUR COMMITMENT TO OUR CUSTOMERS AND TECHNOLOGY INNOVATION ARE SECOND TO NONE!
At Tech Four Tech, our commitment to exceptional service and expertise in all things tech has made us the best place to get your computers and smartphones repaired. Our top priority has always been the customer. We are a proud supporter of Louisiana Tech and do our best to help their students and faculty keep their devices going when they need them most.
Our Mission
Discover Why We're Award-Winning!
Our Philosophy
At Tech 4 Tech, our customers are at the heart of everything we do. We are dedicated to providing the highest level of customer satisfaction by delivering reliable, efficient, and affordable repair solutions. We understand that your devices are essential to your daily life, and we go above and beyond to ensure they are restored to optimal functionality, allowing you to stay connected with the digital world.
Our Promise
We believe in using only the highest quality parts and tools to ensure that your devices are repaired to the highest standards. Whether your phone has a cracked screen, your computer is running slow, or your tablet has battery problems, we employ meticulous attention to detail in every repair we undertake. Our dedication to quality means that we focus on long-lasting solutions that stand the test of time.
Our Guarantee
At Tech 4 Tech, we stand behind the quality of our repairs and the parts we use. We are pleased to offer a lifetime warranty on phone screens. This means that if your phone screen stops working due to a manufacturing defect or faulty installation, we will repair or replace it free of charge. Also included in our insurance package: a free device to borrow if we hold your tech for longer than a day, and discounts for referring us to other customers.
Frequently Asked Questions
What types of devices do you repair?
We specialize in repairing computers and smartphones, including both hardware and software issues.

How long does the repair process usually take?
The repair time can vary depending on the complexity of the issue. However, most repairs are completed within the same day. Phone screen and battery repairs typically take about 30-45 minutes.
Laptop repairs take on average 1-3 days, depending on part delivery time.

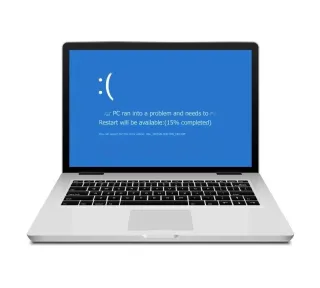
Can you fix software issues like viruses or system crashes?
Yes, we have expertise in diagnosing and resolving various software issues, including virus removal, operating system reinstallation, and system optimization.
Are your technicians certified and experienced?
Yes, our technicians are certified and have extensive experience in the field of computer and phone repairs. They stay up-to-date with the latest industry trends and technologies.

Our Blogs
How Microsoft Excel Tries to Rebrand Work as Excitement
LAST SUMMER, ESPN2 offered viewers the opportunity to spectate an event distinctly incongruous with its usual sport offerings and yet yawn-inducingly familiar: spreadsheet calculation. The ESPN family of channels is no stranger to unconventional programming, with events like the Scrabble Players Championship, Nathan’s Famous Hot Dog Eating Contest, and the World’s Strongest Man Competition. But even by its own standards, the channel had seemingly outdone itself with a half-hour programming slot devoted to the 2022 World Excel Championships. Part of the Financial Modeling World Cup and sponsored by the likes of Microsoft and AG Capital, the event pitted eight Excel wizards against each other to see who could solve tasks most efficiently with table fills and complex formulas under the pressure of a ticking clock. The event has only continued to grow: ESPNU has since broadcast the collegiate equivalent, and the 2023 version will be aired by the ESPN family and held live in Las Vegas with over $15,000 in prize money to boot.
Microsoft Excel—the famed spreadsheet application with number-crunching and graphing capabilities—is the defining software of the white-collar workplace. Canonically categorized as “office productivity software,” its spreadsheet interface can be found on desktop monitors throughout commercials and TV shows as a staple of the cubicle. Along with its siblings Word and PowerPoint, Excel is the basis for curriculum material in schools and universities, a topic of academic research (which has concluded the software is “pervasive in businesses of all sizes”), and the subject of a quite simply enormous subreddit: r/excel boasts over 600,000 “spreadsheet warriors.” Somehow, Excel has also become so ubiquitous as to be recognized as a compelling setting for esports.
THOUGH THE PRACTICE of maintaining bookkeeping and ledger records dates back to ancient Mesopotamia, physical spreadsheet records have always suffered from the problem of requiring corrections and updates by hand. In 1978, while completing assignments at Harvard Business School, MBA student Dan Bricklin recognized the potential for streamlining these calculation inefficiencies using the personal computer. “If only I had a magic piece of paper where I could change a number at the beginning of a set of calculations, and have all of the other numbers automatically recompute themselves …,” he recounted in a course paper. “If only I had an electronic spreadsheet.” Bricklin and his business partner, Bob Frankston, would release VisiCalc, the first spreadsheet software for the personal computer, in 1979. Within a few years, the software would become the most widely used business program for the personal computer to date. Steve Jobs himself quipped that the software “propelled the Apple II to the success it achieved more than any other single event.”
Spreadsheet software was thus a major draw to the personal computer—not simply for “personal” use but rather for business applications and interests. VisiCalc would eventually lose its market dominance to Lotus 1-2-3, new spreadsheet software for the IBM personal computer marketed with additional bells and whistles. Released in 1983, Lotus 1-2-3 would employ new, three-in-one functionality: In addition to spreadsheet manipulation routines (#1), the software would incorporate graphing capabilities (#2) and database functionality (#3), putting the “1-2-3” in the spreadsheet software’s moniker.
To whom was Lotus 1-2-3 marketed? A commercial for the software featuring dancing office workers provides a clear answer. “I never really worked this fast before / Doing things fast means I can do more / Whoever thought that I could do so much? / And all I needed was the Lotus touch!” sings a bespectacled employee now liberated from the error-prone spreadsheet software he had been struggling with at his desk. “Don’t have a lot of time to waste / Looking all around for my database / With this speed, work gets done / It’s time to rock / Time for fun!” proclaims his effusive boss, thrilled at the prospect of optimizing his workers’ time on the clock.
Though Microsoft is now synonymous with Excel, the company’s first foray into spreadsheet software was with the software Multiplan, which launched in 1982 and failed to capture meaningful market share. Microsoft Excel would debut in 1985 on the Apple Macintosh, with which Lotus 1-2-3 was not compatible. As described by Daniel Power in “A History of Microcomputer Spreadsheets,” Excel’s graphical user interface, controlled using a mouse, provided a more intuitive user experience than the command line interfaces employed by most existing spreadsheet programs. However, it was the next version of Excel—compatible with the Windows operating system—that would differentiate the spreadsheet software from Lotus 1-2-3: Excel was the only spreadsheet software available on Windows for many years. Though other competitors have emerged over the decades with new functionalities and strengths (for example, Google Sheets for collaborative work, Tableau for advanced data visualization, and LibreOffice’s Calc from the open source community), Excel continues to dominate the landscape of spreadsheet software almost 40 years later.
Like its forebears, Microsoft Excel has been primarily marketed as a tool for saving time in the business context, reinforced by the very name “Excel.” Consider a magazine advertisement claiming that the software is “the soul of the new machines. And the heart of a business solution that will make as much sense five years from now as it does today.” Or the company’s 1990’s commercial surrounding the Canterbury Clock Company’s incorporation of Excel into its routine business practices—in a metaphor that is perhaps too on-the-nose, the commercial proclaims how Excel saves “lots of time, and time is money.”
EVERY DAY, WE are inundated with charts, graphs, and infographics in contexts as far-ranging as elections and sporting events, purveyed by media outlets including FiveThirtyEight and The New York Times as part of their core journalistic practice. As I have written previously, it is surprising the extent to which these infographics are sexualized, from “sexy” charts to “infoporn” to “map daddy” and “chart-throb” MSNBC election analyst Steve Kornacki. However, if we are to understand the democratization of infographics, we must consider the other setting in which data visualization has become ritualized as a daily practice, and infographic culture has flourished: the white-collar workplace, where pie charts thrive, and Microsoft Excel reigns supreme as the chart-making tool of choice.
Though Excel’s spreadsheet functionalities range from formulas to flash fills to pivot tables, it is the software’s data visualization capabilities that best capture the tool’s primary functionality as improving business efficiency. Excel’s “Chart Wizard” enables users to quickly construct a variety of infographics based on tabular data included in the spreadsheet. Graphical representations abound, including column charts, line charts, pie charts, doughnut charts, bar charts, area charts, scatter and bubble charts, stock charts, surface charts, radar charts, tree-map charts, sunburst charts, histograms, box and whisker plots, waterfall charts, funnel charts, and map charts. Through a simple interface, users can refine chart elements, change colors, and alter the layout of a plot with ease. The power of Excel’s graphical capabilities is precisely this “color-by-number” simplicity, facilitating the construction of infographics by freeing users from the complexity of more expressive data visualization libraries such as JavaScript’s d3.js or Python’s Matplotlib, which require code to be written and Stack Overflow to be frequented.
Yet, despite these flashy infographics enticing us at every turn, Excel endures as a symbol of the banal, synonymous with Office Space’s TPS reports—the resigned territory of listless spreadsheet entry and workplace ennui.
WHAT ARE WE to make of this persistent disparity between the scintillating infographics we consume and the clinical Excel infographics we create at work? It is, of course, the central aspirational deception embedded within pernicious workplace culture: work rebranded as excitement.
It is here that we return to the glut of advertisements that jazz up spreadsheet software to a comical degree, from Microsoft’s proclamation that Excel is the “soul of the new machines” to Lotus 1-2-3 users dancing and singing in the office as they extol the virtues of the software. And it is here that we see the World Excel Championships for what it truly is. Despite being called “almost unbelievably wholesome” by The Atlantic, the event is ultimately an effort to market financial modeling as entertainment, contorting undeniably mundane spreadsheet activities typically reserved for salaried compensation into games rife with anticipation, and rewarding office productivity with the glory of accolades and airtime on cable.
This dressing up of mundane business practices is embedded within spreadsheet software itself. Excel’s Chart Wizard and Function Wizard—simple UI affordances for quickly generating infographics and formulas, respectively—are implied to be magical and whimsical by their very names. A similar phenomenon can be observed within the popularization of the analytics dashboard, which can be created using programs ranging from Tableau to Microsoft Power BI to, yes, Excel. “Much like the dashboard in your vehicle, dashboards display real-time key metrics and performance indicators, guiding decisions and better navigating the surrounding landscape,” Clarivate tells us, with an eye toward productivity. In both name and visual presentation, the analytics dashboard recalls the dashboard of a luxury car or the cockpit of a plane. The analogy is an intentional choice to conjure the seductive thrill of speed from the vantage point of the desk-bound cubicle or home office. “Buckle up!” we seem to be told.
It is not enough that Excel has been designed and marketed with productivity in mind. This misleading practice of embellishing the fundamentally banal is an essential component of the spreadsheet software’s branding that launders productivity as impassioned fun and obscures the labor behind this fun as something office workers should want to do.
Unsurprisingly, the most compelling and creative uses of Excel are those that are remarkably inefficient and devoid of business application: retro console games like The Legend of Zelda: Link’s Awakening recreated using Excel’s Visual Basic language, or Japanese artist Tatsuo Horiuchi’s incredible landscapes painted using Excel’s graphing capabilities come to mind. Entirely distinct from analytics dashboards and earnings projections charts, these inspired endeavors demonstrate the joy that software has the capacity to offer. I do not mean to suggest that Microsoft Excel in particular and spreadsheet software in general do not have their place in a professional context. However, instead of tuning into the World Excel Championship or watching dancing Lotus 1-2-3 users, perhaps it is time for us to turn elsewhere in order to reclaim this joy, unburdened from the insidious rhetoric of productivity and efficiency.
Get in touch with us
(318) 595-0113
support@techfourtech.com
806 North Trenton Street
Monday – Friday 9:00am – 6:00pm
Saturday - 10am-2pm
Sunday – CLOSED


Follow Us
Follow Us
At Tech Four Tech, our commitment to exceptional service and expertise in all things tech has made us the best place to get your computers and smartphones repaired. Our top priority has always been the customer. We are a proud supporter of Louisiana Tech and do our best to help their students and faculty keep their devices going when they need them most.
Services
Contact Us
Monday - Friday, 9:00 - 6:00
Saturday - 10:00 - 2:00
Sunday - CLOSED
support@techfourtech.com
(318)595-0113
806 North Trenton Street
© Copyright 2023. Powered by: Nova Reach